
Authors: Carla Coltharp, Yi Zheng, Kristin Roman, Rachel Schaefer, Ryan Dilworth, Wenliang Zhang,
Kent Johnson, Chi Wang, Linying Liu, Cliff Hoyt, Peter Miller
Issue: SITC 2018 Tradeshow Poster
Background
We describe two advances in multispectral fluorescence immunohistochemistry (fIHC), a powerful tool for quantifying interactions within the tumor microenvironment.
- A fully-automated 8-plex, 9-color assay plus DAPI counterstain on the same tissue section
- A novel scanning method that produces a multispectral whole slide scan of 6 markers plus DAPI counterstain in ~6 minutes (1x1.5 cm tissue section)
Methods
FFPE samples of primary tumors were immunostained using Opal™ reagents manually or on a
Leica BOND RX™. Imagery was acquired on a
Vectra Polaris® automated imaging system and
analyzed with inForm®, MATLAB®, and R
software.
Multiplex Staining with Opal™ Reagents
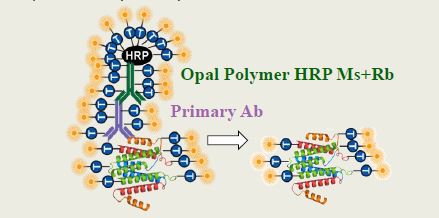
Fig 1. Opal™ Detection. The Opal Polymer HRP
amplifies IHC detection by covalently depositing
multiple Opal fluorophores near the detected antigen.
Then, antibodies are stripped to allow for sequential
labeling of multiple markers.
Multispectral Imaging on Vectra Polaris®
Fig. 2. Multispectral imaging on the Vectra
Polaris is built upon an epifluorescence light
path (below, left). Different combinations of agile
LED bands, bandpass excitation filters, bandpass
emission filters, and a liquid crystal tunable filter
(LCTF) are used to select narrow spectral bands
that reach the imaging sensor.
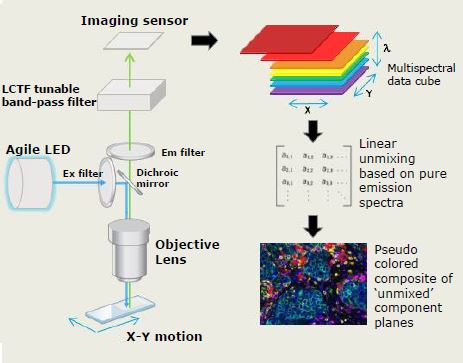
For each spectral band, an image is acquired
and added to a ‘data cube’ that contains up to
40 spectral layers (above, right). The data from
all spectral layers is then linearly unmixed using
previously-determined pure emission spectra for
each fluorophore using inForm® software.
Intensity values in the resulting ‘unmixed’ image
are directly related to the amount of each dye
present.
Results: 9-Color Multispectral Imaging
Field-based multispectral imaging workflows
can accommodate a wide range of fluorophores
and up to 9 colors, but can be time consuming
as they require up to 50 spectral layers to
unmix 9 fluorophores, and often require
exposure times in the hundreds of
milliseconds.
We have developed complementary highthroughput multispectral scanning
approach by optimizing a multispectral
workflow for a specific set of 7
fluorophores.
High-throughput multispectral scanning and
unmixing performed comparably to field-based
multispectral imaging, and outperformed
conventional scanning by:
- Reducing autofluorescence
contributions for all immune markers,
lowering the limit of detection and
extending the dynamic range of some
channels by more than 30-fold.
- Reducing crosstalk from more than 8% to
under 3% (typically <0.5%), thereby
increasing signal accuracy and reducing
false colocalization between non-colocalized
markers.
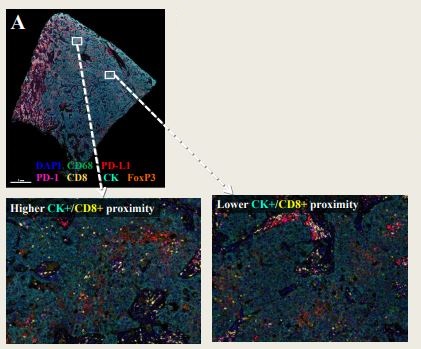
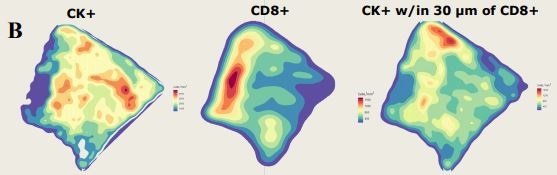
Fig 6. Cell density and interaction density across the whole slide.
A) Whole slide MSI of human lung cancer section captured in 6 minutes,
shown as composite image with marker colors indicated in key. Cells were
phenotyped in inForm®, and interactions assessed with R and phenoptr. (Bottom) Zoomed in views of A) illustrate
differences in CD8+ T-cell (yellow) infiltration within the tissue.
B) Density contours of CK+ (left), CD8+ (middle), and CK+ within 30 µm
of a CD8+ cell (right).
Conclusions
We introduce a 9-color fIHC assay
that distinguishes 8 markers plus
DAPI counterstain on the same tissue
section, increasing the depth of
cellular interactions that can be
studied within the tumor
microenvironment.
Additionally, we introduce a whole
slide multispectral imaging
method that provides rich
quantitation of interactions among 6
markers at length scales spanning
from cell biology to tumor physiology.
BOND RX is for Research Use Only. Not For Use In Diagnostic Procedures.
LEICA and the Leica Logo are registered trademarks of Leica Microsystems IR GmbH.
BOND is a trademark of Leica Biosystems Melbourne Pty Ltd