
Authors: Peter Miller, Yi Zheng, Darryn Unfricht, Wenliang Zhang, Kent Johnson, Carla Coltharp
Issue: Digital Pathology Association: Visions 2018 Tradeshow Poster
Background
Digital pathology methods are of growing value for
studying fluorescently-labeled samples, to obtain
quantitative expression measures and to take advantage
of multiple markers. At the same time, multiplexed
immunofluorescence (mIF) labeling techniques and
multispectral imaging systems have made it practical to
measure up to 7 colors per specimen, enabling insight
into complex samples such as are present in immunooncology studies.
We report on a new platform that brings these together.
It includes optimized dyes, software, and a scanner that
performs rapid whole-slide multispectral imaging of
FFPE samples (6 minutes for an entire section).
This enables studying cell-to-cell interactions over
multiple spatial scales; and measuring heterogeneity in
immune response across the tumor microenvironment.
Methods: Staining & Scanning
Formalin-fixed paraffin-embedded samples of
primary lung cancer tumors were immunostained
using an Opal™ Polaris 7 detection kit, with primary
antibodies targeting PDL1, PD1, CD8, CD68, FoxP3, and
cytokeratin. Staining was done on a Leica BOND RXTM.
A novel, high-throughput whole-slide multispectral
scanning workflow was used to digitize the samples:
- Scanning with Vectra Polaris using agile LED illumination
and multiband filters to produce the required spectral
bands. Scan time is 6 minutes for a 1 x 1.5 cm
sample at 20x
- The raw multispectral imagery was stored as a pyramidal
tiff (QPTIFF) with no compression; it was 2.6 GB in size.
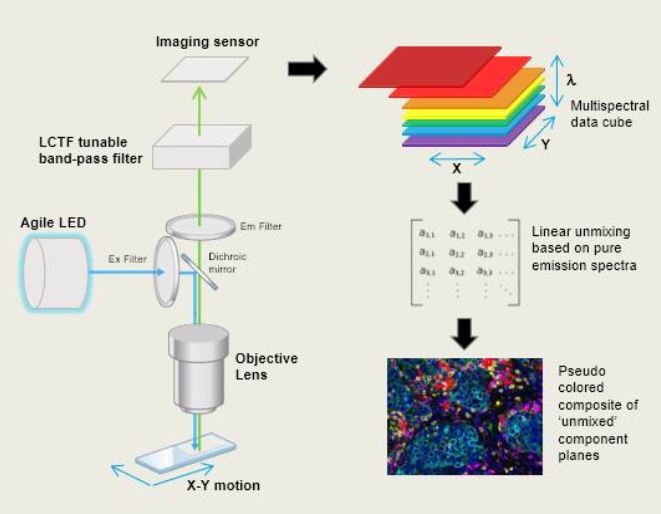
Fig. 1. Multispectral imaging on the Vectra Polaris is built upon
an epifluorescence light path (above, left). Different
combinations of agile LED bands, bandpass excitation filters,
bandpass emission filters, and a liquid crystal tunable filter (LCTF) are
used to select narrow spectral bands that reach the imaging sensor.
Methods: Image Viewing & Analysis
Multispectral software was used to view and analyze
the samples.
- Analysis regions were selected by drawing annotations
using a special version of the Phenochart viewer. When
desired, the entire sample could be selected and
analyzed.
- The viewer used unmixing-on-demand to obtain pure
components, with autofluorescence isolation and
this guided the operator during region selection.
- A one-time measurement of an autofluorescence witness
slide was used for all subsequent slides.
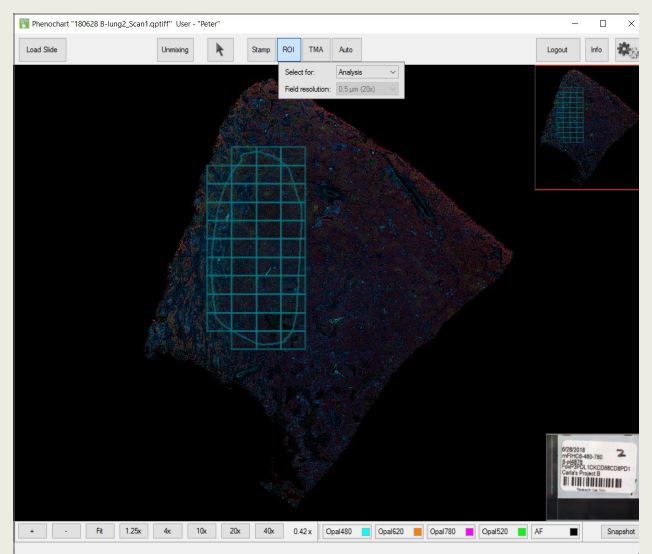
Fig. 2: Viewing and annotation of the multispectral scan. The
Phenochart viewer provides a composite view of the sample at all
zoom levels using an unmix-on-demand scheme. This enables the
usual digital pathology interactions with a multispectral dataset.
Selected regions were analyzed using a special
version of inForm software, which processed the
regions directly from the raw multispectral scan and the
annotations. Spectra were measured from control samples.
- It, too, used unmix-on-demand to process the large
dataset efficiently, without intermediate steps or files
- Cells were then segmented and phenotyped for positivity
in each marker based on operator-trained classifiers
Phenotyping and segmentation obtained this way
were compared with results from field-based MSI
methods
- Non-adjacent sections were prepared from the same
block, using the Opal™ Polaris 7 detection kit, and the
standard Opal™ detection kit, using the same Abs
- The standard Opal™ kit sample was imaged using fieldbased MSI on a Vectra Polaris and analyzed in inForm
- The Opal™ Polaris 7 detection kit sample was imaged
using the whole-slide workflow tools described above
- While this work is preliminary, results appear consistent
across the two methods.
Example: Heterogeneity Of A Lung Cancer Sample
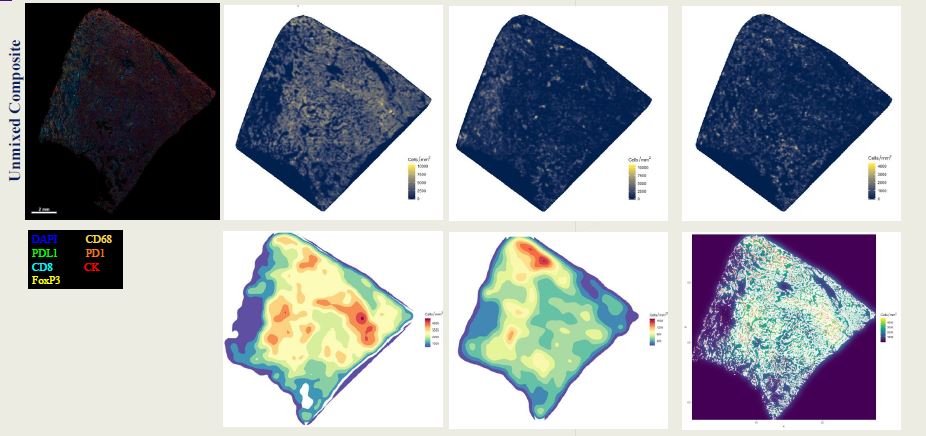 Fig 3. Cell density and interaction density. Lung cancer section, shown as composite image with marker colors indicated in key. Cells were phenotyped
in inForm, and interactions assessed with R and Phenoptr. Heatmaps on the top row show cellular density for tumor cells, CD8+, and CD8+ within 30 µm
of a tumor cell. Bottom row shows density contours of CK+; contours of CK+ within 30 µm of a CD8+ cell; and a satellite view showing CD8+ as red dots
if within 30 µm of a tumor cell and white dots otherwise, with tumor cells shown in gradient colors as shown in the key
Fig 3. Cell density and interaction density. Lung cancer section, shown as composite image with marker colors indicated in key. Cells were phenotyped
in inForm, and interactions assessed with R and Phenoptr. Heatmaps on the top row show cellular density for tumor cells, CD8+, and CD8+ within 30 µm
of a tumor cell. Bottom row shows density contours of CK+; contours of CK+ within 30 µm of a CD8+ cell; and a satellite view showing CD8+ as red dots
if within 30 µm of a tumor cell and white dots otherwise, with tumor cells shown in gradient colors as shown in the key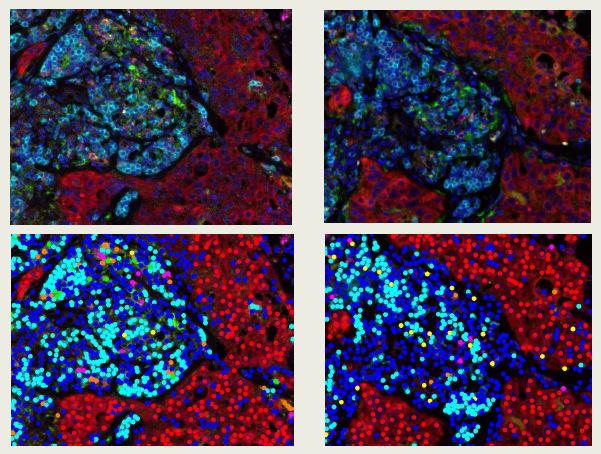
Fig. 4. Comparison with field-based results. This shows results
from field-based acquisition and analysis on the left, with the
corresponding portion of another section from the same block
processed with whole-slide multispectral methods on the right.
The entire section was selected, and we analyzed
cell populations and cell-interactions at a variety of
spatial scales across the entire section
- Tables of cell data, containing location, expression of
each marker, phenotype assignment, and other data
were subjected to spatial analysis
- R and the Phenoptr package were used to identify cells
with a given phenotype; or cells of given phenotype for
which a neighboring cell of a specified type is adjacent,
as a measure of cellular interaction
- The results were visualized using heatmap, contour, and
satellite views to show the density and distribution of
cells and their interactions across the sample
Conclusions
Whole slide multispectral workflows have been
demonstrated that greatly simplify multiplexed tissue
studies through the following innovations:
- Rapid whole-slide scanning for 6-plex (7-color)
samples with only a single operator touch-point
- Viewer and analysis software with unmix-on demand to enable the usual digital pathology
workflows for these complex image sets
- The datasets are ripe for studying cells and
their interactions at all spatial scales either
within a region or across the entire sample
The resulting scan time and file size – 6 minutes, and
2.5 GB per slide – make this technique practical even
for large studies. In turn, the information content of
these spatially complete, rich datasets recommends
them for biomarker hunting and translational use.
a. BOND RX is for Research Use Only. Not For Use In Diagnostic Procedures.
b. LEICA and the Leica Logo are registered trademarks of Leica Microsystems IR GmbH.
c. BOND is a trademark of Leica Biosystems Melbourne Pty Ltd.